The Oilers In Seven — part four: Things balancing out?#Oilers #yeg #LetsGoOilers oilersnation.com/2019/12/03/the…

Nation Sites
The Nation Network
OilersNation has no direct affiliation to the Edmonton Oilers, Oilers Entertainment Group, NHL, or NHLPA
The Oilers In Seven — part five: Well, that was ugly
Photo credit: © Perry Nelson-USA TODAY Sports

By Zach Laing
Dec 18, 2019, 19:00 ESTUpdated: Dec 18, 2019, 16:04 EST
Hello, hello, hello.
Welcome back to part five of my series Oilers In Seven where we take a look at the Oilers in, well, seven-game sets.
If you’re new to the series, welcome! For those reading once again, welcome! This series is here to give you a better understanding of the Oilers on a smaller scale.
Feedback is welcome in the comments, or on Twitter.
The Numbers
Games 1-7: 6-1, .857 points %
Games 8-15: 4-3-1, .563
Games 16-22: 3-2-2, .571
Games 23-29: 4-3, .571
Games 30-36: 2-4-1, .357
Games 8-15: 4-3-1, .563
Games 16-22: 3-2-2, .571
Games 23-29: 4-3, .571
Games 30-36: 2-4-1, .357
Season record: 19-13-4, 11th in the NHL, .583 points%
Games 1-7:
PP% – 45.5, 1st overall.
PK% – 88.5, 5th.
PP% – 45.5, 1st overall.
PK% – 88.5, 5th.
Games 8-15:
PP% — 9.5, 26th overall.
PK% — 81.8, 18th.
PP% — 9.5, 26th overall.
PK% — 81.8, 18th.
Games 16-22:
PP% — 39.1, 2nd overall.
PK% — 92.0, 3rd.
PP% — 39.1, 2nd overall.
PK% — 92.0, 3rd.
Games 23-29:
PP% — 35.7, 4th overall.
PK% — 85.0, 10th.
PP% — 35.7, 4th overall.
PK% — 85.0, 10th.
Games 30-36:
PP% — 28.5, 6th overall.
PK% — 68.7, 28th.
PP% — 28.5, 6th overall.
PK% — 68.7, 28th.
Season totals:
PP% — 31.4, 1st overall.
PK% — 84.4, 5th.
PP% — 31.4, 1st overall.
PK% — 84.4, 5th.
Even Strength
STAT | RATE G1-7 + LEAGUE RANK | RATE G8-15 + LEAGUE RANK | RATE G16-22 + LEAGUE RANK | RATE G23-29 + LEAGUE RANK | RATE G30-36 + LEAGUE RANK | SEASON TOTALS |
CF% | 44.02 – 30TH | 50.13 — 16TH | 48.97 — 18TH | 47.45 — 23RD | 45.43 — 29TH | 47.31 — 27TH |
GF% | 54.55 – 10TH | 50.00 — 17TH | 48.65 — 18TH | 44.12 — 24TH | 30.00 — 31ST | 45.28 — 28TH |
XGF% | 41.96 – 30TH | 53.25 — 10TH | 52.79 — 8TH | 48.58 — 20TH | 42.15 — 29TH | 48.06 — 26TH |
GF/60 | 3.1 — 9TH | 1.89 — 29TH | 3.19 — 10TH | 2.5 — 15TH | 1.56 — 30TH | 2.39 — 26TH |
GA/60 | 2.58 — 11TH | 1.89 — 4TH | 3.36 — 25TH | 3.16 — 24TH | 3.65 — 30TH | 2.89 — 24TH |
TEAM SH% | 12.95 – 3RD | 6.25 — 28TH | 10.71 — 9TH | 8.57 — 14TH | 5.56 — 30TH | 8.46 — 18TH |
TEAM SV% | .9167 – 11TH | 93.23 — 4TH | 88.82 — 23RD | 90.59 — 23RD | 88.33 — 30TH | 90.58 — 22ND |
PDO | 1.046 – 3RD | 99.5 — 20TH | 99.5 — 16TH | 99.2 — 19TH | 93.9 — 30TH | 99.0 — 24TH |
All Situations
STAT | RATE G1-7 + LEAGUE RANK | RATE G8-15 + LEAGUE RANK | RATE G16-22 + LEAGUE RANK | RATE G23-29 + LEAGUE RANK | RATE G30-36 + LEAGUE RANK | SEASON TOTALS |
CF% | 43.96 — 30TH | 50.56 — 17TH | 49.23 — 19TH | 45.96 — 25TH | 47.66 — 23RD | 47.57 — 27TH |
GF% | 59.57 — 5TH | 45.45 — 23RD | 54.00 — 9TH | 45.24 — 24TH | 39.53 — 28TH | 49.30 — 21ST |
XGF% | 40.50 — 30TH | 52.59 — 12TH | 50.49 — 14TH | 47.41 — 24TH | 47.18 — 22ND | 47.91 — 24TH |
GF/60 | 3.95 — 3RD | 1.84 — 30TH | 3.83 — 5TH | 2.68 — 16TH | 2.42 — 26TH | 2.91 — 18TH |
GA/60 | 2.68 — 11TH | 2.21 — 5TH | 3.26 — 19TH | 3.25 — 24TH | 3.7 — 30TH | 3.0 — 16TH |
TEAM SH% | 15.64 — 1ST | 6.07 — 29TH | 12.80 — 4TH | 9.45 — 17TH | 8.17 — 23RD | 10.13 — 10TH |
TEAM SV% | .9177 — 9TH | 92.50 — 4TH | 88.78 — 22ND | 90.50 — 21ST | 87.50 — 30TH | 90.32 — 20TH |
PDO | 1.074 — 1ST | 0.986 — 23RD | 101.6 — 10TH | 99.9 — 19TH | 95.7 — 29TH | 1.005 — 14TH |
Stats via Natural Stat Trick, glossary with definitions here.
Player Stats
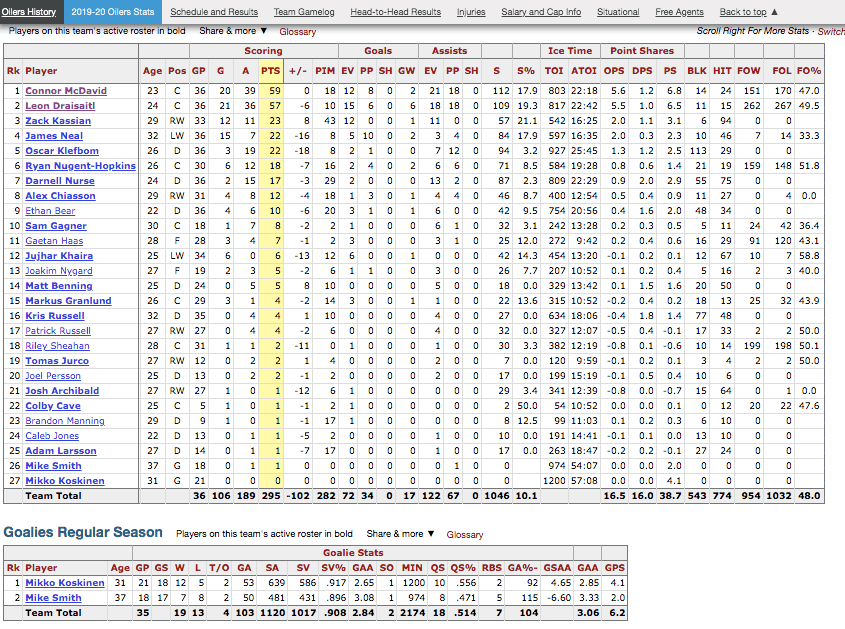
Stats via Hockey Reference
What it all means
Well, that was ugly. No other way to put it.
It was the Oilers worst seven-game stretch of the season putting up an awful .357 points percentage. There were moments reminiscent of the Decade Of Darkness and there were times I’m sure many turned off their TVs.
What made things tough, too, is five of those seven games were at home where Edmonton only won a single game — a 2-1 win over L.A. Edmonton bled goals giving up four-plus goals four times.
The underlying numbers were not pleasant for Edmonton, either. At even-strength, they ranked among the worst in every stat I’ve tracked this year as they didn’t really do anything good whatsoever.
If anything, the one real positive we could take away from this stretch of games is the team has continued to be red hot operating at a top of the league clip. As a whole, Edmonton’s powerplay numbers this year have been operating at a historic clip. It’s currently ranked 2nd all-time — a half percent behind the 1977-78 Montreal Canadiens.
Edmonton’s skid gets tough tonight against the St. Louis Blues, but they see some reprieve with more favourable matchups against teams like the Canucks, Canadiens, Sabres and Rangers.
Any early-season lead the Oilers built has since been squandered. They’re now in the midst of an absolute brawl in the Western Conference with four points separating the top of the Pacific Division, and the second wildcard spot.
Edmonton needs to bounce back to keep their playoff hopes up.
On Twitter: @zjlaing
Breaking News
- McDavid’s hat trick, five-point night give Oilers big 5-2 win over Sharks: Recap, Reaction, and Highlights
- GDB 79.0: Oilers look to stop the slide in final matchup vs. the Sharks (8pm MT, SNW)
- Oilers Game Notes: Road trip continues against San Jose team desperate for points
- Oilers prospects William Nicholl, Tommy Lafrenière sign ATO’s to join Condors
- Oilers Prospect Update: Condors close to clinching playoff spot with 6 games remaining