
Nation Sites
The Nation Network
OilersNation has no direct affiliation to the Edmonton Oilers, Oilers Entertainment Group, NHL, or NHLPA
The Oilers In Seven — part seven: Even-strength play leads the way
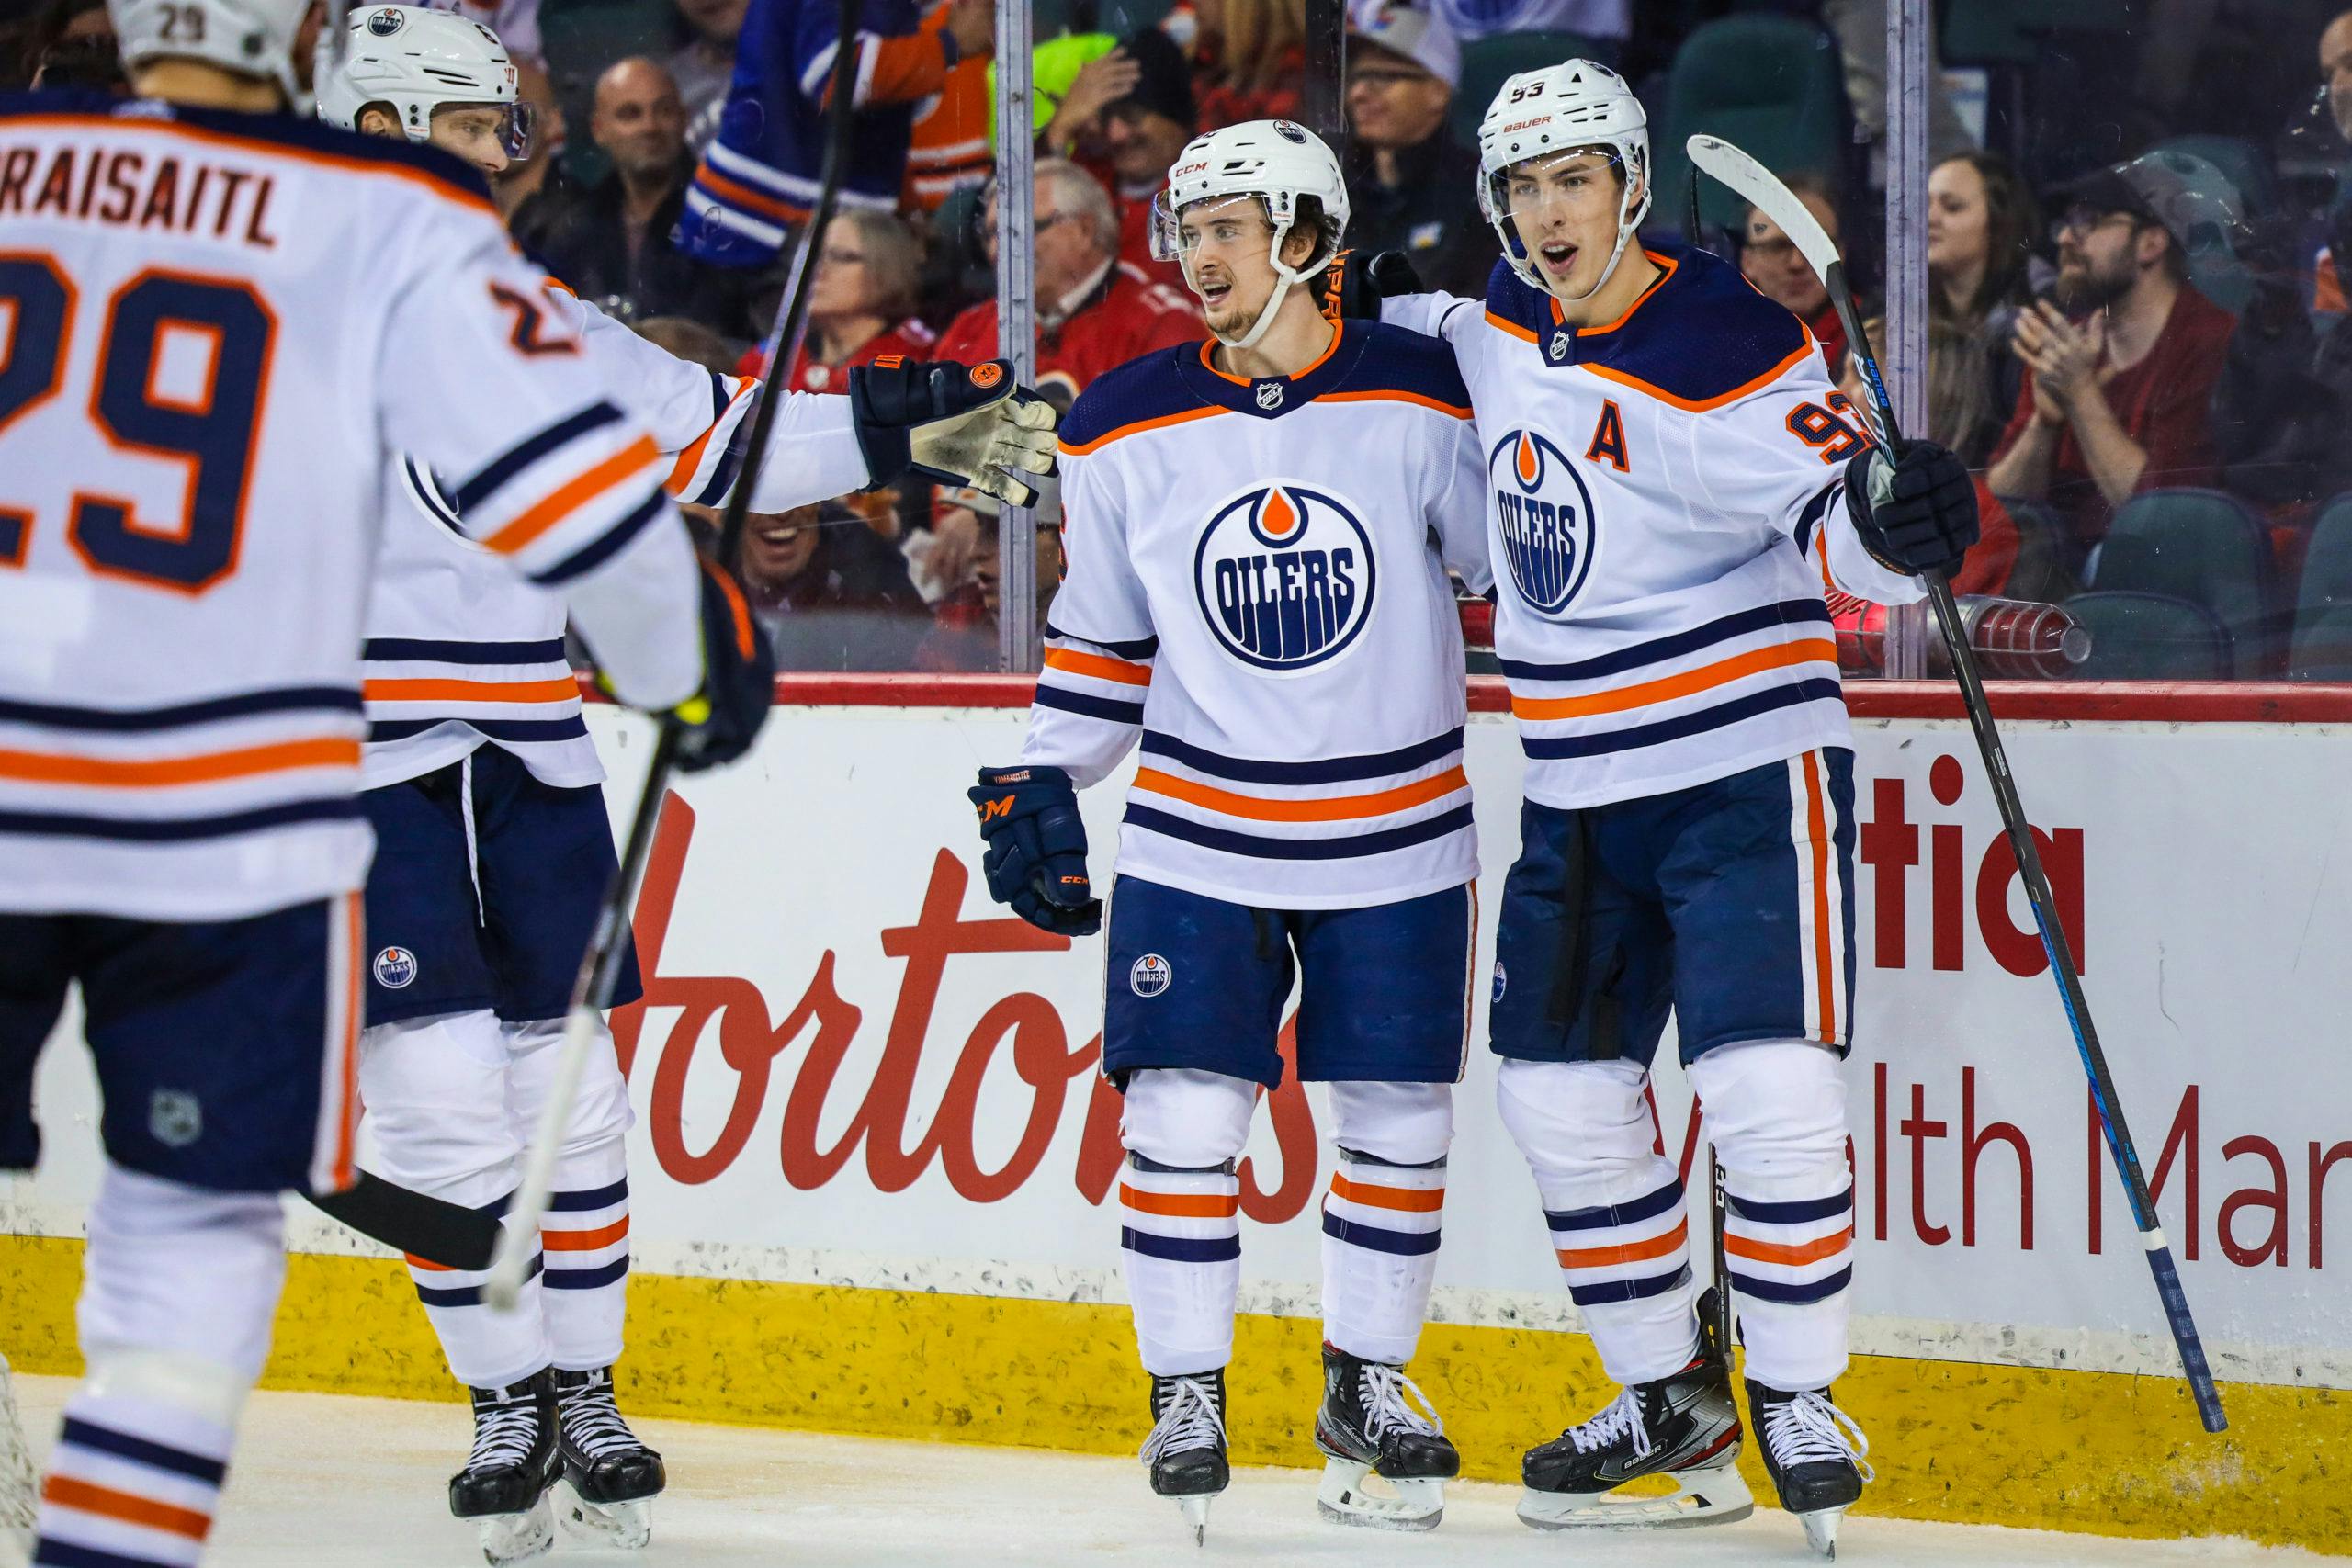
Photo credit: Sergei Belski-USA TODAY Sports

By Zach Laing
Feb 2, 2020, 16:00 ESTUpdated: Feb 3, 2020, 13:28 EST
Hello, hello, hello.
Welcome back to part six of my series Oilers In Seven where we take a look at the Oilers in, well, seven-game sets. This time is a little different as we’re looking at the Oilers last nine game set. More on that under all the numbers in the write-up, however.
If you’re new to the series, welcome! For those reading once again, welcome! This series is here to give you a better understanding of the Oilers on a smaller scale.
Feedback is welcome in the comments, or on Twitter.
The Numbers
Games 1-7: 6-1, .857 points %
Games 8-15: 4-3-1, .563
Games 16-22: 3-2-2, .571
Games 23-29: 4-3, .571
Games 30-36: 2-4-1, .357
Games 37-43: 2-4-1, .357
Games 44-52: 7-1-1, .833
Games 8-15: 4-3-1, .563
Games 16-22: 3-2-2, .571
Games 23-29: 4-3, .571
Games 30-36: 2-4-1, .357
Games 37-43: 2-4-1, .357
Games 44-52: 7-1-1, .833
Season record: 28-18-6, ,593 points %, 12th in the NHL
Games 1-7
PP% – 45.5, 1st overall.
PK% – 88.5, 5th.
PP% – 45.5, 1st overall.
PK% – 88.5, 5th.
Games 8-15:
PP% — 9.5, 26th overall.
PK% — 81.8, 18th.
PP% — 9.5, 26th overall.
PK% — 81.8, 18th.
Games 16-22:
PP% — 39.1, 2nd overall.
PK% — 92.0, 3rd.
PP% — 39.1, 2nd overall.
PK% — 92.0, 3rd.
Games 23-29:
PP% — 35.7, 4th overall.
PK% — 85.0, 10th.
PP% — 35.7, 4th overall.
PK% — 85.0, 10th.
Games 30-36:
PP% — 28.5, 6th overall.
PK% — 68.7, 28th.
PP% — 28.5, 6th overall.
PK% — 68.7, 28th.
Games 37-43:
PP% — 22.7, 17th overall.
PK% — 76.9, 15th.
PP% — 22.7, 17th overall.
PK% — 76.9, 15th.
Games 44-52:
PP% — 26.9, 9th overall.
PK% — 79.2, 19th.
PP% — 26.9, 9th overall.
PK% — 79.2, 19th.
Season totals:
PP% — 29.5, 1st overall.
PK% — 82.9, 8th.
PP% — 29.5, 1st overall.
PK% — 82.9, 8th.
Even Strength
STAT | RATE G1-7 + LEAGUE RANK | RATE G8-15 + LEAGUE RANK | RATE G16-22 + LEAGUE RANK | RATE G23-29 + LEAGUE RANK | RATE G30-36 + LEAGUE RANK | RATE G37-43 + LEAGUE RANK | RATE G44-52 + LEAGUE RANK | SEASON TOTALS |
CF% | 44.02 – 30TH | 50.13 — 16TH | 48.97 — 18TH | 47.45 — 23RD | 45.43 — 29TH | 46.08 — 23RD | 51.00 — 13TH | 47.84 — 26TH |
GF% | 54.55 – 10TH | 50.00 — 17TH | 48.65 — 18TH | 44.12 — 24TH | 30.00 — 31ST | 36.24 — 30TH | 63.46 — 3RD | 48.16 — 24TH |
XGF% | 41.96 – 30TH | 53.25 — 10TH | 52.79 — 8TH | 48.58 — 20TH | 42.15 — 29TH | 49.55 — 14TH | 54.20 — 5TH | 49.38 — 16TH |
GF/60 | 3.1 — 9TH | 1.89 — 29TH | 3.19 — 10TH | 2.5 — 15TH | 1.56 — 30TH | 2.19 — 26TH | 4.26 — 1ST | 2.7 — 18TH |
GA/60 | 2.58 — 11TH | 1.89 — 4TH | 3.36 — 25TH | 3.16 — 24TH | 3.65 — 30TH | 3.53 — 25TH | 2.45 — 10TH | 2.9 — 25TH |
TEAM SH% | 12.95 – 3RD | 6.25 — 28TH | 10.71 — 9TH | 8.57 — 14TH | 5.56 — 30TH | 7.78 — 25TH | 12.84 — 2ND | 9.25 — 14TH |
TEAM SV% | .9167 – 11TH | 93.23 — 4TH | 88.82 — 23RD | 90.59 — 23RD | 88.33 — 30TH | 87.86 — 28TH | 92.18 — 7TH | 90.52 — 25TH |
PDO | 1.046 – 3RD | 99.5 — 20TH | 99.5 — 16TH | 99.2 — 19TH | 93.9 — 30TH | 95.6 — 29TH | 105 — 3RD | 99.8 — 21ST |
All Situations
STAT | RATE G1-7 + LEAGUE RANK | RATE G8-15 + LEAGUE RANK | RATE G16-22 + LEAGUE RANK | RATE G23-29 + LEAGUE RANK | RATE G30-36 + LEAGUE RANK | RATE G37-43 + LEAGUE RANK | RATE G44-52 + LEAGUE RANK | SEASON TOTALS |
CF% | 43.96 — 30TH | 50.56 — 17TH | 49.23 — 19TH | 45.96 — 25TH | 47.66 — 23RD | 46.66 — 22ND | 50.52 — 16TH | 47.99 — 27TH |
GF% | 59.57 — 5TH | 45.45 — 23RD | 54.00 — 9TH | 45.24 — 24TH | 39.53 — 28TH | 41.30 — 28TH | 64.18 — 2ND | 51.22 — 14TH |
XGF% | 40.50 — 30TH | 52.59 — 12TH | 50.49 — 14TH | 47.41 — 24TH | 47.18 — 22ND | 51.74 — 10TH | 55.75 — 1ST | 49.87 — 17TH |
GF/60 | 3.95 — 3RD | 1.84 — 30TH | 3.83 — 5TH | 2.68 — 16TH | 2.42 — 26TH | 2.71 — 25TH | 4.73 — 1ST | 3.2 — 11TH |
GA/60 | 2.68 — 11TH | 2.21 — 5TH | 3.26 — 19TH | 3.25 — 24TH | 3.7 — 30TH | 3.85 — 27TH | 2.64 — 8TH | 3.05 — 20TH |
TEAM SH% | 15.64 — 1ST | 6.07 — 29TH | 12.80 — 4TH | 9.45 — 17TH | 8.17 — 23RD | 9.22 — 22ND | 14.53 — 1ST | 10.85 — 4TH |
TEAM SV% | .9177 — 9TH | 92.50 — 4TH | 88.78 — 22ND | 90.50 — 21ST | 87.50 — 30TH | 87.38— 27TH | 91.72 — 7TH | 90.18 — 19TH |
PDO | 1.074 — 1ST | 0.986 — 23RD | 101.6 — 10TH | 99.9 — 19TH | 95.7 — 29TH | 96.6 — 27TH | 106.3 — 2ND | 101 — 10TH |
Stats via Natural Stat Trick, glossary with definitions here.
Player Stats
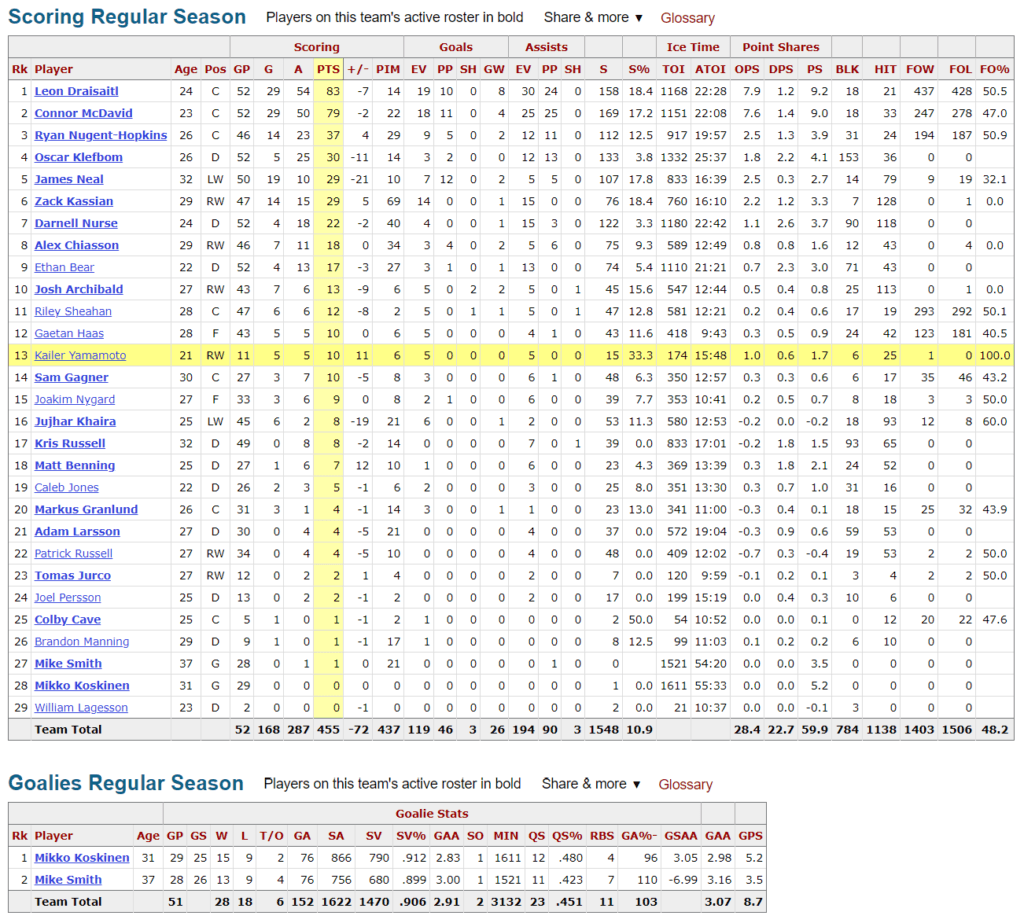
Stats via Hockey Reference
What it all means
As I mentioned earlier, I choose to break down this stretch over a nine-game span vs. the usual seven games. Edmonton has been playing some of their best game of the season and seven games was a fairly small sample size during that time given nearly every other team. It’s also going to give even sets moving forward the rest of the way, except for the final set which will see eight games.
Nonetheless, the Oilers have been absolutely on fire for all off the new year. Edmonton has cruised out to a 7-1-1 record in their last games and are playing their best even-strength hockey of the season. They posted their second positive CF% stretch of games and have played their best all-around hockey of the season.
Their expected goals for rate of 54.2 was their best of the year and truly indicative of how well they’ve played at even-strength. It’s been a key for an Oilers club who have dominated in terms of special teams all season. Their powerplay still paces the league at 29.5% while their penalty kill chugs along at 82.9%, too.
It can’t be stressed enough how important it is for Edmonton to start clicking with strong even-strength play. It’s been key in this nine-game stretch as their penalty kill posted their third-worst stretch of the season.
Their even-strength goal scoring was very impressive scoring 4.26 goals per hour in the clubs’ best stretch — by a long shot — that has helped propel the club forward. The Oilers second line of Ryan Nugent-Hopkins, Leon Draisaitl and Kailer Yamamoto each on the ice for over a dozen goals.
They’ve been tremendous at even-strength since they were put together on New Year’s Eve and there’s no doubt the trio won’t be going anywhere for a while. It’s also freed up Connor McDavid, too, who has been on one of his best stretches individually. He’s led the way driving play with a 56.38 CF% and a strong 56.97 xGF%.
Over the next seven games, Edmonton plays @ Arizona, vs. SJ, Nashville and Chicago, before a three-game road trip @ Tampa, Florida and Carolina. The front four games of the stretch are crucial games for the Oilers as all but San Jose are still in the hunt for a wild card spot in the west.
On Twitter: @zjlaing
Breaking News
- Two Oilers land on projected Canadian 2028 World Cup of Hockey roster
- Why Rickard Rakell might not be the home-run swing the Oilers need
- Peter Pocklington’s 1984 mistake changed Stanley Cup protocols
- NHL Notebook: Ducks match Carlsson offer sheet, Bourgault re-signs with Sens
- Why the modern three-goalie system is the right gamble for Edmonton

Edmonton OilersTeam Cap Summary

Cap Summary
2026-27
2027-28
Projected Cap Hit
$98,074,166
$86,150,000
Projected Cap Space
$5,925,834
$27,350,000
Current Cap Space
$5,925,834
$27,350,000
Active Players
22/23
14/23
Draft Picks
Round
'26
'27
1
0
0
2
1
1
3
1
0