

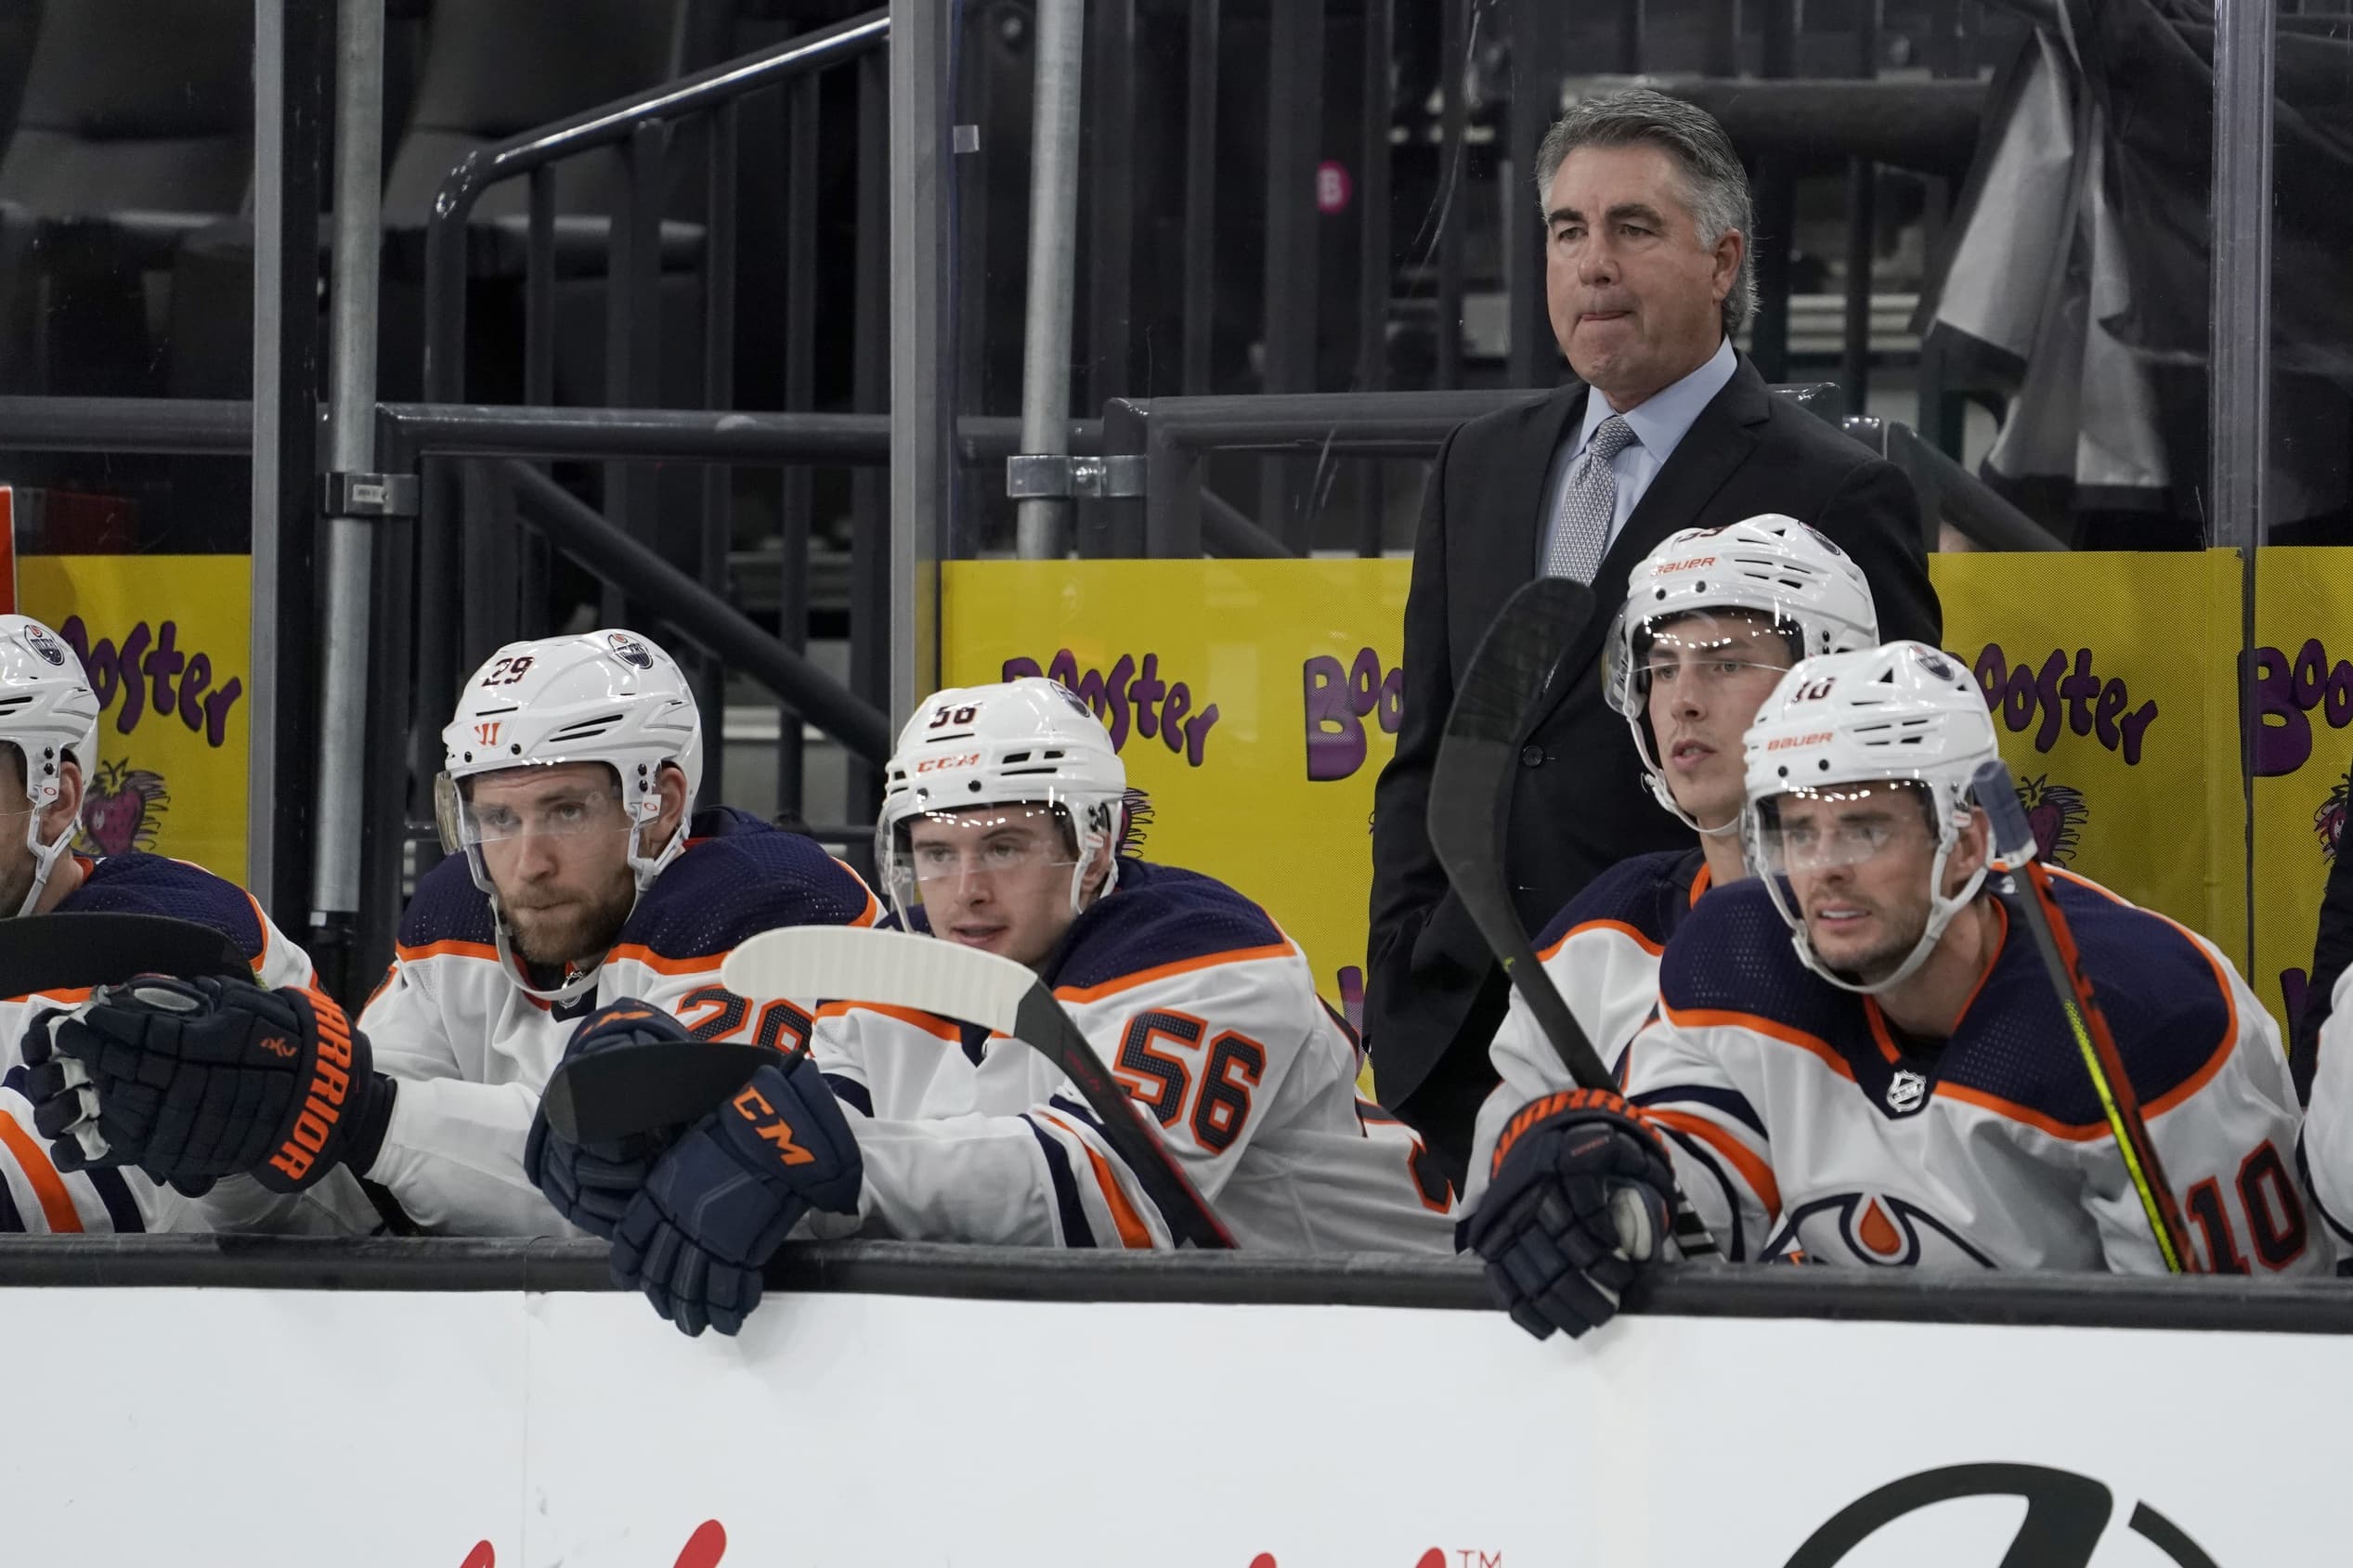

For the second time in three seasons, the Edmonton Oilers are 5-0. They couldn’t have scripted a better start. And now the question is: How well will they play moving forward?
In 2019/2020 they started 5-0, and then went 32-25-9 in their next 66 games. They were in second place in the Pacific Division when the season was halted due to COVID. They were three points behind Vegas, and five ahead of Vancouver, although the Canucks had two games in hand. They were comfortably in a playoff spot, but none of us know where they would have finished.
I believe this group is deeper than that team. If the Oilers only win 48.4% of their remaining games, like they did two seasons ago, that would be a disappointment. However, this hot start gives them a nice foundation to start the season. If they go 40-32-5 they’d finish with 95 points, which equates to winning only 52% of their final 77 games. Compare that to Vegas, who is 1-4. The Golden Knights need to win 57% of their remaining games to get to 45 wins. And they are still without Max Pacioretty for another month, Alex Tuch for three more months and Mark Stone’s back injury makes him a major question mark.
A good start is a major benefit for any team. It reduces the need to have to play great. Here is a quick look at the Oilers’ five-game segments of 2020.
5-0-0 3-1-1 (game 45)
2-2-1 3-1-1
3-2-0 3-2-0
2-2-1 3-1-1
3-1-1 2-2-1
2-3-0 3-1-1
1-3-1 0-1-0
2-3-0 (game 40)
2-2-1 3-1-1
3-2-0 3-2-0
2-2-1 3-1-1
3-1-1 2-2-1
2-3-0 3-1-1
1-3-1 0-1-0
2-3-0 (game 40)
They went 15-16-4 in games #6-#40, then were much better in January to March, going 17-9-5. They treaded water for the next two and a half months after their great start. They need avoid doing that again. With Vegas struggling offensively, now is the time for the Oilers to ensure they win three out of every five games and extend their points lead over the Golden Knights and the rest of the division.
They have played well, especially offensively, but they have areas to clean up.
They are allowing too many shots at 5×5. They are 29th in shots against per game at 5×5. They aren’t giving up loads of quality chances (more on that in a moment), but they do need to reduce the shots against. They have done a good job of allowing teams to settle for shots from non-dangerous areas, but as we saw in the Pittsburgh/Toronto game on Saturday, when you direct shots on goal good things can happen. None of Pittsburgh’s first four goals went in off of a Penguins stick. One went in off a Penguin’s hip, and the other three went in off of a Toronto player’s stick. The more pucks you allow on goal, the more chances for chaos. So Edmonton needs to limit their shots against at 5×5.
While they are giving up a lot of shots, they aren’t leaking shots from the most dangerous areas. These numbers are courtesy of Sportlogiq.


Edmonton ranks 19th in shots allowed from the slot, eighth in inner shots and seventh overall in shots form the slot. They have done well limiting chances from the most dangerous areas on the ice. Ideally, they’d like to be higher in those categories as well, and I know Dave Tippett will be focusing on better defensive zone coverage.
Jesse Puljujarvi, Connor McDavid and Leon Draisaitl have the highest shots against/60 among forwards in the top three lines. That will come down. As well as they’ve played offensively, McDavid’s line has spent too much time defending. Tyson Barrie has also struggled and that’s likely why he and Evan Bouchard changed pairings against Vegas. The great news for Tippett is that he can focus on his top players in the video room. It gets their attention — and the rest of the roster’s. It might sound strange, but being 5-0 is the perfect time to point out deficiencies during video session. Their confidence is high and they will handle it better.
Ken Hitchcock always felt the best time to be hard on players was when the team was winning. “They can handle constructive criticism better,” he said. “When you are losing you have to try and pump them up while mentioning weaknesses.”
As mentioned the team isn’t horrible defensively, with 15 skaters posting an xGF% of over 50%, but their 5×5 goals against and shots against need to drop as the season progresses. They’ve allowed two goals against/game thus far. Of the 10 goals (5×5) they’ve allowed in their five games, four came against the Ducks. In a small sample size, one game can alter the numbers, but all teams are in the same small sample size. Edmonton needs to be around 1.80, or lower, to be considered a top-12 team defensively. That is based on the previous few seasons. If goal scoring remains high, then that number is likely a bit higher.
OTHER INTERESTING NUMBERS…
— Duncan Keith and Cody Ceci have only started 8.5% of their shifts (static starts, not on fly) in the offensive zone. They’ve started four of 47 shifts in the offensive zone.
Player | Off. Zone Starts | Neu. Zone Starts | Def. Zone Starts | On Fly Starts |
1 | 1 | 2 | 28 | |
3 | 4 | 3 | 30 | |
4 | 22 | 21 | 51 | |
4 | 24 | 19 | 49 | |
6 | 15 | 7 | 57 | |
14 | 20 | 12 | 57 | |
15 | 11 | 8 | 55 |
Last season Adam Larsson was at 16% (67 of 418)
Kris Russell was 22% (67 or 280)
Slater Koekkoek was 25% (22 of 87)
Ethan Bear was 29% (77 of 265)
Darnell Nurse 31% (142 of 457)
Caleb Jones was 32.7% (52 of 159)
Tyson Barrie was 33% (132 of 397)
Kris Russell was 22% (67 or 280)
Slater Koekkoek was 25% (22 of 87)
Ethan Bear was 29% (77 of 265)
Darnell Nurse 31% (142 of 457)
Caleb Jones was 32.7% (52 of 159)
Tyson Barrie was 33% (132 of 397)
If you look at simply defensive zone starts (again, not including on the fly), Keith and Ceci are taking the bulk of those starts compared to how Jim Playfair used his D-men last year.
Here is last season and each individual’s percentage of Dzone starts.
Russell 35.3%
Larsson 35.1%
Koekkoek 29.8%
Jones 27.6%
Bear 27.5%
Nurse 23.8%
Barrie 23.6%.
Russell 35.3%
Larsson 35.1%
Koekkoek 29.8%
Jones 27.6%
Bear 27.5%
Nurse 23.8%
Barrie 23.6%.
And here is this season (albeit a small sample size):
Russell 50% (only four total starts).
Ceci 44.7%
Keith 40.4%
Koekkoek 30%
Nurse 26.1%
Bouchard 25%
Barrie 23.5%
Ceci 44.7%
Keith 40.4%
Koekkoek 30%
Nurse 26.1%
Bouchard 25%
Barrie 23.5%
It is something to monitor, but I won’t be surprised if the Keith/Ceci pair continues to hover around 40%. They are veterans who know how to check. They don’t mirror people (just stay between your man and the net, but rarely confront them) or sword check (swinging stick, not using body to close in), which is what the Blackhawks are asked to do and why they are terrible defensively.
OFFENCE IS ROLLING…
It isn’t a surprise to see McDavid and Draisaitl leading the league in scoring, but both are averaging over two points per game. They’ve been crushing it and we could see two teammates with 130 points for the first time since 1996 when Jaromir Jagr and Mario Lemieux did it. In fact, only five times have NHL teammates each scored 130 points in the same season.
1996: Lemieux (161) and Jagr (149) with Pittsburgh.
1989: Wayne Gretzky (168) and Bernie Nicholls (150) in Los Angeles.
1986: Gretzky (215), Paul Coffey (138) and Jari Kurri (131) in Edmonton. *Doubt we see three teammates do it ever again.*
1985: Gretzky (208) and Kurri (135) in Edmonton.
1971: Phil Esposito (152) and Bobby Orr (139).
1989: Wayne Gretzky (168) and Bernie Nicholls (150) in Los Angeles.
1986: Gretzky (215), Paul Coffey (138) and Jari Kurri (131) in Edmonton. *Doubt we see three teammates do it ever again.*
1985: Gretzky (208) and Kurri (135) in Edmonton.
1971: Phil Esposito (152) and Bobby Orr (139).
McDavid became the 12th player in NHL history to start the season with five consecutive multi-point games. (Mario Lemieux in 2001 and Marian Hossa didn’t play in the first game of the season, but did have five or multi-point games to start their season.)
**Sweeney Schriner is a great name, so is Newsy Lalonde. And a huge thanks to Stuart for the chart.**
**Sweeney Schriner is a great name, so is Newsy Lalonde. And a huge thanks to Stuart for the chart.**

Gretzky holds the Oilers record with seven multi-point games to start the season. He accomplished that in 1983/1984. He scored 20 points in the first seven games and began the season on a 51-game point streak. He was held scoreless for the first time on January 28th v. the LA Kings. He then missed six games with an injury. He returned and scored at least one point in 20 of the remaining 22 games.
He played 74 games that year and had a point in 71 of of them. He scored 205 points in 74 games. Here were his games and point totals.
Three games zero points.
19 games one point.
15 games two points.
16 games three points.
6 games four points.
11 games with five points.
1 game with six points.
1 game with seven points.
2 games with eight points.
Three games zero points.
19 games one point.
15 games two points.
16 games three points.
6 games four points.
11 games with five points.
1 game with six points.
1 game with seven points.
2 games with eight points.
McDavid won’t score 200 points, but 150 seems realistic. He already has five multi-point games and is destined for many more.
In 2017 he had 30 multi-point games.
In 2018 he had 32 and 36 in 2019.
He had 26 mutli-point games in 2020 in 64 games.
Last season he had 33 in only 56 games which was 58.9% of his games.
In 2018 he had 32 and 36 in 2019.
He had 26 mutli-point games in 2020 in 64 games.
Last season he had 33 in only 56 games which was 58.9% of his games.
Over the past five seasons his percentage of multi-point games in a season is as follows:
He was 26.5% in 2017, then 39%, followed by 46.1%, then 40% in 2020 (coming off an injury) and then 58.9% last year.
I see the low mark at 50 games this year, 60.9%. If he has 58 multi-point games he’d be at 70.7% and to reach 75% he’d have 62 multi-point games. The numbers are mind-blowing, but McDavid looks poised to have that type of dominant season. Enjoy the ride.
