DOES BIRTHDATE MATTER?

By Jason Gregor
10 years ago
Does the month you are born in give you a better chance to play in the NHL? In 2008, Malcolm Gladwell wrote the book, Outliers, which focused on different factors that might influence people’s success. It looked at the Beatles, Bill Gates, law firms and other successful companies and people. He also wrote on why the majority of NHL hockey players were born in the first three months of the year.
He often mentioned the "10,000 hour" rule as the key to anyone’s success. He wrote that most people who reach high levels of success put in at least 10,000 hours of practice before gaining success. That premise makes a lot of sense, but after reading his book, I questioned if the birth month numbers matched today’s NHL.
Gladwell pointed out that kids born in January, February and March have an advantage in minor hockey because they are on average more physically mature than kids born later in the year, especially between the ages of 7-16. Those kids were in most cases bigger, stronger and more mature than kids born later in the year, thus they had an advantage.
Gladwell pointed out that kids born in January, February and March have an advantage in minor hockey because they are on average more physically mature than kids born later in the year, especially between the ages of 7-16. Those kids were in most cases bigger, stronger and more mature than kids born later in the year, thus they had an advantage.
The numbers matched his theory; however, if you look at today’s NHL player, the "early birthday" advantage seems to have diminished.
Here is a chart from 2008 showing the difference between kids born in the first quarter (Jan-March) to those born in the final quarter (Oct-Dec) courtesy of behindthenet.ca
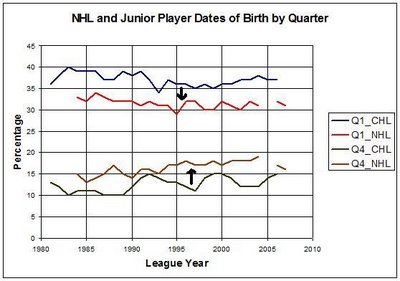
You will notice in 1985 there was almost a 30% difference for kids in junior hockey, while in 2005 it was about a 22% difference. In the NHL the gap was 17% in 1985 and closer to 12% around 2005.
Fast forward to today and let’s look at the breakdown of the Oilers:
| Name | Date Of Birth | Age |
| Mike Brown | 24-Jun-85 | 28 |
| Jordan Eberle "A" | 15-May-90 | 23 |
| Sam Gagner | 10-Aug-89 | 24 |
| Boyd Gordon | 19-Oct-83 | 29 |
| Taylor Hall "A" | 14-Nov-91 | 21 |
| Ales Hemsky | 13-Aug-83 | 30 |
| Jesse Joensuu | 5-Oct-87 | 25 |
| Ryan Jones | 14-Jun-84 | 29 |
| Anton Lander | 24-Apr-91 | 22 |
| Ryan Nugent-Hopkins | 12-Apr-93 | 20 |
| David Perron | 28-May-88 | 25 |
| Ryan Smyth | 21-Feb-76 | 37 |
| Nail Yakupov | 6-Oct-93 | 19 |
| Name | Date Of Birth | Age |
| Anton Belov | 29-Jul-86 | 27 |
| Andrew Ference | 17-Mar-79 | 34 |
| Denis Grebeshkov | 11-Oct-83 | 29 |
| Oscar Klefbom | 20-Jul-93 | 20 |
| Philip Larsen | 7-Dec-89 | 23 |
| Jeff Petry | 9-Dec-87 | 25 |
| Corey Potter | 5-Jan-84 | 29 |
| Justin Schultz | 6-Jul-90 | 23 |
| Nick Schultz "A" | 25-Aug-82 | 30 |
| Ladislav Smid | 1-Feb-86 | 27 |
| Name | Date Of Birth | Age |
| Devan Dubnyk | 4-May-86 | 27 |
| Jason LaBarbera | 18-Jan-80 | 33 |
Of this 25-man roster, the Oilers have:
Five players born in Q1, and three of them are the oldest players on the team. (20%)
Seven players born in Q2 (Apr-June). (28%)
Six players born in Q3 (July-Sept) (24%)
Seven players born in Q4. (28%)
Five players born in Q1, and three of them are the oldest players on the team. (20%)
Seven players born in Q2 (Apr-June). (28%)
Six players born in Q3 (July-Sept) (24%)
Seven players born in Q4. (28%)
In the past five years it seems we’ve seen a swing regarding the birth month of NHL players. 28% of the Oilers were born in Q4, while 20% were born in Q1. That is significantly different from the league average in 2008, when 31% were born in Q1 and 19% were born in Q4.
Are the Oilers an anomaly?
I looked at last seasons top-30 goal scorers to see.
| Player | Birth month | GP | G | A | P | |
| 1 | Martin St Louis | June | 48 | 17 | 43 | 60 |
| 2 | Steven Stamkos | February | 48 | 29 | 28 | 57 |
| 3 | Alex Ovechkin | October | 48 | 32 | 24 | 56 |
| 4 | Sidney Crosby | August | 36 | 15 | 41 | 56 |
| 5 | Patrick Kane | November | 47 | 23 | 32 | 55 |
| 6 | Eric Staal | October | 48 | 18 | 35 | 53 |
| 7 | Chris Kunitz | September | 48 | 22 | 30 | 52 |
| 8 | Phil Kessel | October | 48 | 20 | 32 | 52 |
| 9 | Taylor Hall | November | 45 | 16 | 34 | 50 |
| 10 | Pavel Datsyuk | July | 47 | 15 | 34 | 49 |
| 11 | Ryan Getzlaf | May | 44 | 15 | 34 | 49 |
| 12 | Mike Ribeiro | February | 48 | 13 | 36 | 49 |
| 13 | Jonathan Toews | April | 47 | 23 | 25 | 48 |
| 14 | Claude Giroux | January | 48 | 13 | 35 | 48 |
| 15 | Henrik Zetterberg | October | 46 | 11 | 37 | 48 |
| 16 | Nicklas Backstrom | November | 48 | 8 | 40 | 48 |
| 17 | John Tavares | September | 48 | 28 | 19 | 47 |
| 18 | Jakub Voracek | August | 48 | 22 | 24 | 46 |
| 19 | Andrew Ladd | December | 48 | 18 | 28 | 46 |
| 20 | Henrik Sedin | September | 48 | 11 | 34 | 45 |
| 21 | Derek Stepan | June | 48 | 18 | 26 | 44 |
| 22 | Nazem Kadri | October | 48 | 18 | 26 | 44 |
| 23 | Matt Moulson | November | 47 | 15 | 29 | 44 |
| 24 | Alexander Semin | March | 44 | 13 | 31 | 44 |
| 25 | PA Parenteau | March | 48 | 18 | 25 | 43 |
| 26 | Matt Duchene | January | 47 | 17 | 26 | 43 |
| 27 | Rick Nash | June | 44 | 21 | 21 | 42 |
| 28 | Anze Kopitar | August | 47 | 10 | 32 | 42 |
| 29 | Thomas Vanek | January | 38 | 20 | 21 | 41 |
| 30 | Blake Wheeler | August | 48 | 19 | 22 | 41 |
Here is the breakdown:
Q1: Seven players (23.3%)
Q2: Five players (16.7%
Q3: Eight players (26.7%)
Q4: Ten players (33.3%)
Q2: Five players (16.7%
Q3: Eight players (26.7%)
Q4: Ten players (33.3%)
The gap amongst the top scorers was even bigger, however, 30 isn’t that large of sample size, so I looked at the top-120 scoring forwards.
The results:
Q1: 33 players (27.5%)
Q2: 28 players (23.3%)
Q3: 30 players (25.0%)
Q4: 29 players (24.2%)
Q2: 28 players (23.3%)
Q3: 30 players (25.0%)
Q4: 29 players (24.2%)
The stats reverted back to what Gladwell had pointed out; however, there was only a 3% difference between Q1 and Q4 amongst forwards.
What about the top-60 scoring D-men?
Here is the breakdown:
Q1: 17 players (28.3%)
Q2: 15 players (25.0%)
Q3: 16 players (26.7%)
Q4: 12 players (20.0%)
Q2: 15 players (25.0%)
Q3: 16 players (26.7%)
Q4: 12 players (20.0%)
I also did a quick breakdown on the top-30 goalies. (based on minute leader for each team)
Q1: 11 players (36.7%)
Q2: 7 players (23.3%)
Q3: 7 players (23.3%)
Q4: 5 players (16.7%)
Q2: 7 players (23.3%)
Q3: 7 players (23.3%)
Q4: 5 players (16.7%)
It was interesting to note the massive difference in Q1and Q4 when it comes to goalies, so I looked at all 82 goalies who played at least one game in the NHL last year: The remaining 52 goalies looked much different than the top-30 (minutes played) goalies, and the numbers changed significantly.
Q1: 22 players (26.8%)
Q2: 26 players (31.7%)
Q3: 25 players (30.5%)
Q4: 9 players (11.0%)
Q2: 26 players (31.7%)
Q3: 25 players (30.5%)
Q4: 9 players (11.0%)
My conclusion, which is very scientific, regarding goalies is that they live up to their "they are odd ducks" stereotype. If you want a solid starting goalie, their Jan-March birth date seems to play a bigger role than it does for D-men or forwards.
CONCLUSION….
If you add all the numbers, top-120 scoring forwards, top-60 scoring D-men and the starting 30 goalies we get this:
Q1: 60 players (28.5%)
Q2: 50 players (23.8%)
Q3: 53 players (25.2%)
Q4: 46 players (21.9%)
Q2: 50 players (23.8%)
Q3: 53 players (25.2%)
Q4: 46 players (21.9%)
The gap between Q1 and Q4 is now less than 7%. If you scroll back to the first chart, this small sample size does match up, albeit at a quicker pace, of narrowing the gap.
Why are we seeing the gap shrink?
Summer and spring hockey likely has played a factor. Kids can get more icetime than before, thus giving them a better chance to fulfill Gladwell’s "10,000 hours of practice" theory. But is that the only factor?
Before the season starts, I will calculate every forward, D-man and goalie that played in the NHL this past season to see how the remaining players alter, or not, the % of NHL players based on their birth month.
RANDOM THOUGHTS AND ROAD TRIP
- The Eskimos find a way to look unorganized every week. Yesterday the coaching staff looked to have forgotten the rules regarding possession after a FG compared to kicking off after a TD. Those types of mistakes and errors can’t keep happening.
- The Eskimos offence is improving under Mike Reilly. Reilly threw for 511 yards yesterday, 4th all-time in Eskimos history, and he’s playing with more poise every week. The defence, however, is getting worse. Marcus Howard has been invisible most of the season, while D-coordinator Greg Marshall’s system seems a bit passive. Their defence needs to show signs of improvement soon.
- Interesting to see the list of the top-25 remaining UFAs. Would any of them be long-term solutions in Edmonton? No, however, if the Oilers need a stop-gap a few of them are intriguing. If you could sign Grabovski for a one-year deal, especially with Nugent-Hopkins unlikely to start the season, I’d look at that. Has Tom Gilbert fallen that far that he can’t even crack the top-25 remaining UFA list? Ouch.
- I went to San Fransisco for my holidays and highly recommend it for anyone. If you go, you have to see the city from a unique vantage point. We rented a Go Car, and I instantly felt like Cartman. "RESPECT MY AUTHOROTIE". The Go Car is great, because you can drive all over the city, and it has a GPS voice narrator who tells you the history of streets and monuments that you pass. Plus you get a lot of respect when you drive that bad boy around the city.

- Another must see is Muir Woods. The Redwoods are spectacular and no picture truly does them justice. Many of the trees stand more than 15 stories high. They are a must see.

- Of course you need to go tour Alcatraz. You can watch a 15-minute video that gives you the history of the Island when you arrive. They also give you a set of headphones when you tour the prison to learn all about the prisoners and daily life in the prison. It was eerie walking though the prison, and when you looked in the cells, especially solitary confinement, it gave me chills. They also gave some excellent history and feedback about all the events that happened on the Island: War time, the prison, escape attempts and the 19-month Indian occupation in 1969-1971.

- As a sports guy I had to take in a Giants game. AT&T park is a great venue. The atmosphere and view was spectacular just off the ocean, and when the sun comes out it is scorching hot. The defending World Series champs don’t have much power this year. Best stat I learned on the trip. In 2001, Barry Bonds hit 73 home runs in 476 at-bats. In 2013, the Giants needed 4,160 at-bats combined to hit 73 homers. Yikes.

-
Food can make or break on a holiday and San Fran has awesome food. My best recommendations are: The Slanted Door. It is in the Ferry Building and it has a wide array of choices. The fish is tantalizing.
- Speaking of food…I went to a new restaurant in Edmonton last night. The Plow and Harvest. They have a unique style were they seat you, allow you to look at the menu, and then go order your food. They call it Fresh-Casual. I like it. The best part is the chefs prepare all the food fresh and only use local products. They have a great beer selection, and lots of tasty food choices. I recommend the Grilled Cheese. It has Bourbon Bacon Jam. Seriously, Bacon Jam, maybe the greatest new invention of food I’ve ever tasted.
Cafe Mocca. A great place for lunch. It feels like you are in Paris. It is a deli style restaurant where you go order you food and then sit outside under umbrellas while a musician plays.
The Bix. A great jazz place with excellent food and tasty wine and beer menu.
Tomasso’s Pizza. Outstanding pizza, with a great beer selection and the prices are a steal. If you are planning a holiday, I’d look at San Francisco. You won’t be disappointed.
RECENTLY BY JASON GREGOR
Recent articles from Jason Gregor