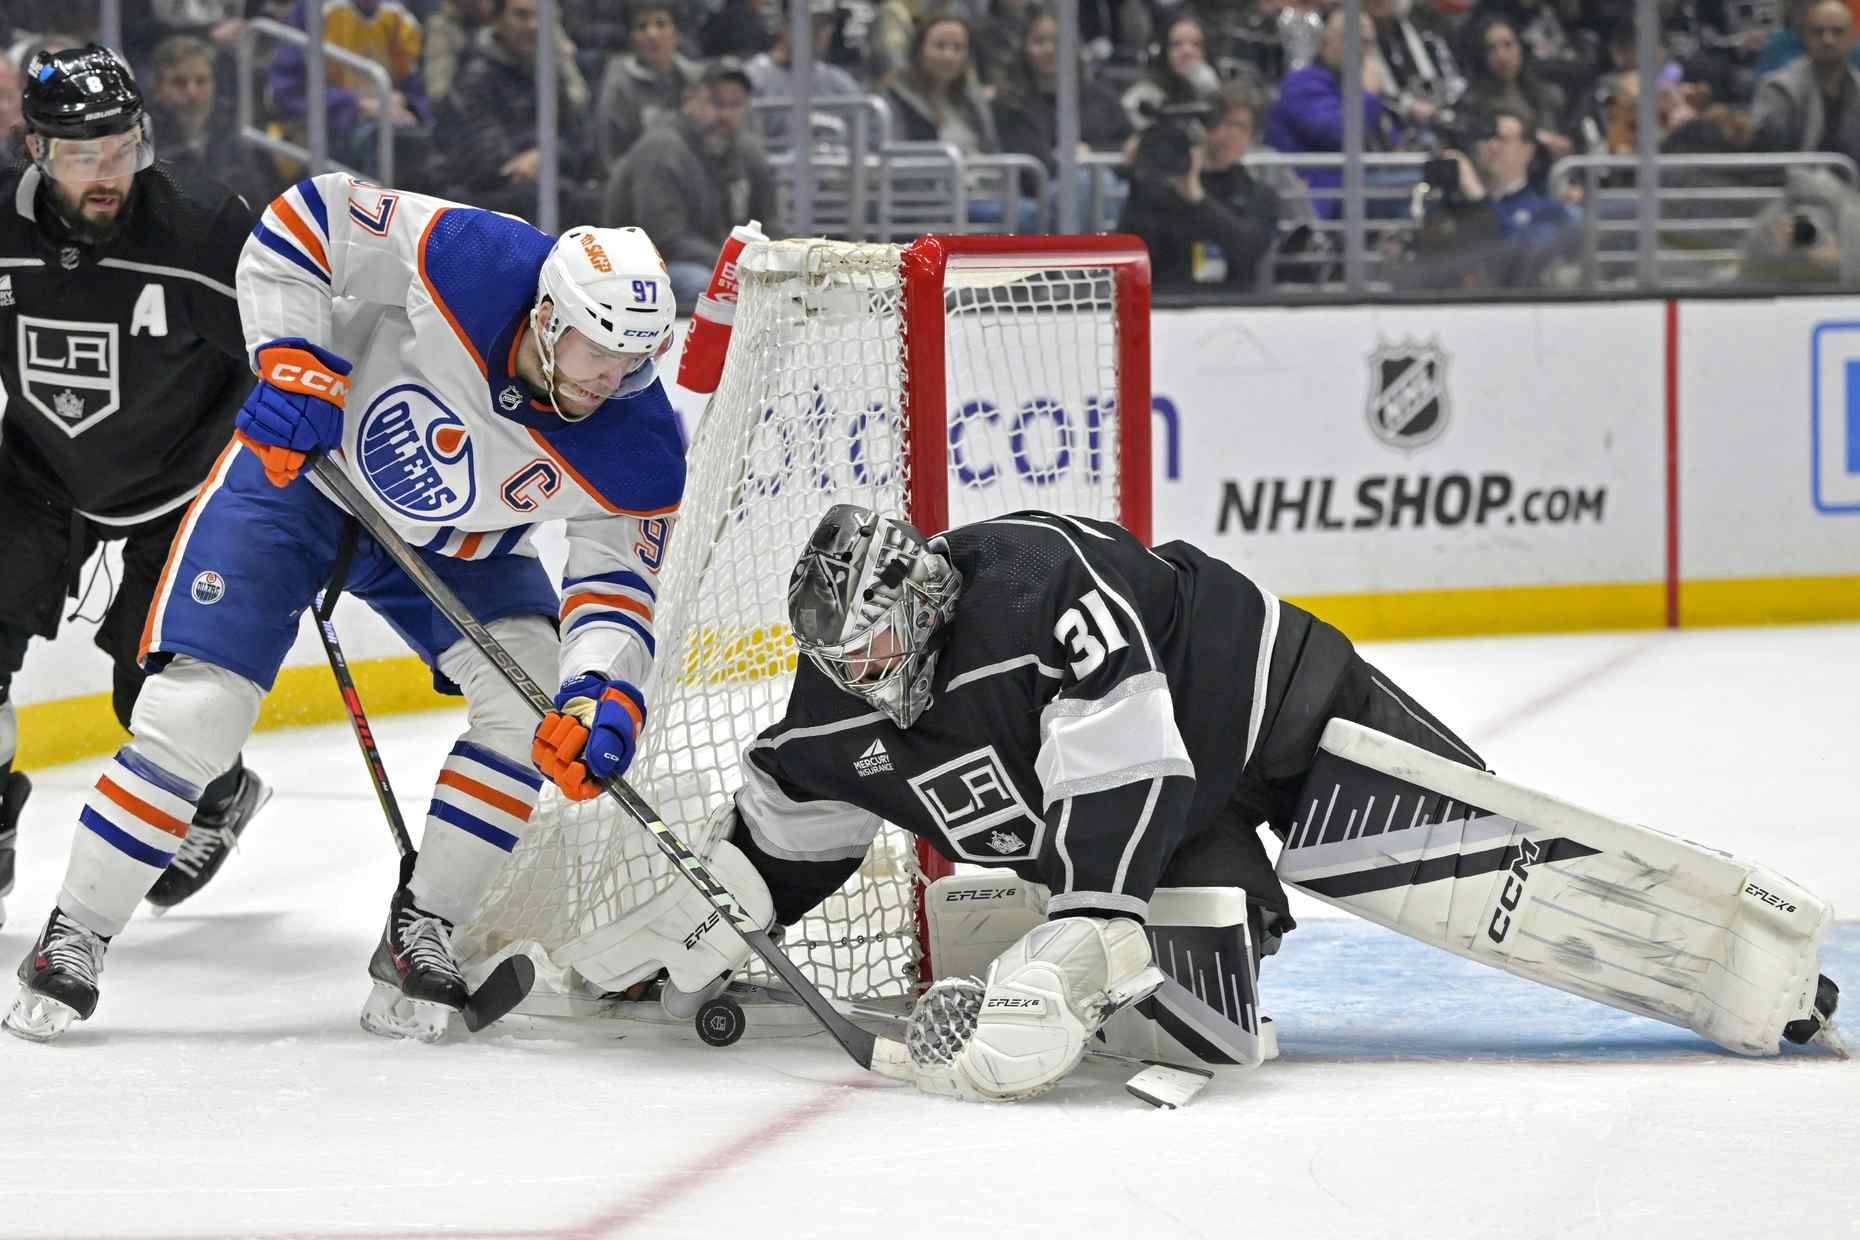
How many goals will Jordan Eberle score next season?
Jordan Eberle had a great 2011-12 season. However, his goal-scoring was largely shooting percentage-based – does that mean it’s going to drop off, or is Eberle one of the league’s rare high-percentage shooters?
To try and answer that question, I decided to look at a group of 15 players since the mid-1990’s who had posted shooting percentage totals similar to Jordan Eberle over their first two seasons. The list is as follows, with the group average compared to Eberle’s totals over his first two seasons at the bottom:
| Rk | Player | From | To | GP | G | A | PTS | S | S% |
|---|---|---|---|---|---|---|---|---|---|
| 1 | Mark Parrish | 1999 | 2000 | 154 | 50 | 31 | 81 | 281 | 17.8 |
| 2 | Jonathan Toews | 2008 | 2009 | 146 | 58 | 65 | 123 | 339 | 17.1 |
| 3 | Paul Stastny | 2007 | 2008 | 148 | 52 | 97 | 149 | 323 | 16.1 |
| 4 | Alexander Radulov | 2007 | 2008 | 145 | 44 | 51 | 95 | 279 | 15.8 |
| 5 | Evgeni Malkin | 2007 | 2008 | 160 | 80 | 111 | 191 | 514 | 15.6 |
| 6 | Steven Stamkos | 2009 | 2010 | 161 | 74 | 67 | 141 | 478 | 15.5 |
| 7 | Lee Stempniak | 2006 | 2007 | 139 | 41 | 38 | 79 | 266 | 15.4 |
| 8 | Thomas Vanek | 2006 | 2007 | 163 | 68 | 64 | 132 | 441 | 15.4 |
| 9 | Ilya Kovalchuk | 2002 | 2003 | 146 | 67 | 51 | 118 | 441 | 15.2 |
| 10 | Ryan Malone | 2004 | 2006 | 158 | 44 | 43 | 87 | 292 | 15.1 |
| 11 | Dany Heatley | 2002 | 2003 | 159 | 67 | 89 | 156 | 454 | 14.8 |
| 12 | Martin Havlat | 2001 | 2002 | 145 | 41 | 51 | 92 | 278 | 14.7 |
| 13 | Alexander Semin | 2004 | 2007 | 129 | 48 | 47 | 95 | 335 | 14.3 |
| 14 | Sidney Crosby | 2006 | 2007 | 160 | 75 | 147 | 222 | 528 | 14.2 |
| 15 | Jonathan Cheechoo | 2003 | 2004 | 147 | 37 | 26 | 63 | 269 | 13.8 |
| Average | 151 | 56 | 65 | 121 | 368 | 15.3 | |||
| * | Jordan Eberle | 2011 | 2012 | 147 | 52 | 67 | 119 | 338 | 15.4 |
As we can see, the averages compare very well to Eberle’s two-year totals, so this would seem to be a comparable group. How did they do in their third NHL season?
To answer that question, I’ve nixed Alexander Radulov (he left for Russia after his second NHL season) and gathered the numbers for this group’s third year:
| Player | GP | G | SH | SH% |
|---|---|---|---|---|
| Mark Parrish | 70 | 17 | 123 | 13.8% |
| Jonathan Toews | 76 | 25 | 202 | 12.4% |
| Paul Stastny | 45 | 11 | 118 | 9.3% |
| Evgeni Malkin | 82 | 35 | 290 | 12.1% |
| Steven Stamkos | 82 | 45 | 272 | 16.5% |
| Lee Stempniak | 80 | 13 | 162 | 8.0% |
| Thomas Vanek | 82 | 36 | 240 | 15.0% |
| Ilya Kovalchuk | 81 | 41 | 341 | 12.0% |
| Ryan Malone | 64 | 16 | 125 | 12.8% |
| Dany Heatley | 31 | 13 | 83 | 15.7% |
| Martin Havlat | 67 | 24 | 179 | 13.4% |
| Alexander Semin | 63 | 26 | 185 | 14.1% |
| Sidney Crosby | 53 | 24 | 173 | 13.9% |
| Jonathan Cheechoo | 82 | 56 | 317 | 17.7% |
| Total | 958 | 382 | 2810 | 13.6% |
| Average | 68 | 27 | 201 | 13.6% |
The games played total is lower, but I wouldn’t read too much into that – it’s really a function of three players (Stastny, Heatley and Crosby) missing time in their third seasons. Overall, shooting percentage fell significantly – Stamkos and Cheechoo were the significant exceptions, though Cheechoo would fall off the map over the next two seasons – but an increase in shot rates made up the vast majority of the difference.
Based on this group, we would expect Jordan Eberle to see a jump in total shots, a slight dip in shooting percentage, and maintain similar goal-scoring numbers next season. Or would we?
The Other Way of Looking At It

In our initial look at this problem, we considered the first and second years of these players as one sample, not bothering to split up those two seasons to see how much progress each player made. If we do that, how does Eberle compare to the average?
| Player | 1GP | 1G | 1S | 1SH% | 2GP | 2G | 2S | 2SH% |
|---|---|---|---|---|---|---|---|---|
| Mark Parrish | 73 | 24 | 129 | 18.6% | 81 | 26 | 152 | 17.1% |
| Jonathan Toews | 64 | 24 | 144 | 16.7% | 82 | 34 | 195 | 17.4% |
| Paul Stastny | 82 | 28 | 185 | 15.1% | 66 | 24 | 138 | 17.4% |
| Evgeni Malkin | 78 | 33 | 242 | 13.6% | 82 | 47 | 272 | 17.3% |
| Steven Stamkos | 79 | 23 | 181 | 12.7% | 82 | 51 | 297 | 17.2% |
| Lee Stempniak | 57 | 14 | 100 | 14.0% | 82 | 27 | 166 | 16.3% |
| Thomas Vanek | 81 | 25 | 204 | 12.3% | 82 | 43 | 237 | 18.1% |
| Ilya Kovalchuk | 65 | 29 | 184 | 15.8% | 81 | 38 | 257 | 14.8% |
| Ryan Malone | 81 | 22 | 139 | 15.8% | 77 | 22 | 153 | 14.4% |
| Dany Heatley | 82 | 26 | 202 | 12.9% | 77 | 41 | 252 | 16.3% |
| Martin Havlat | 73 | 19 | 133 | 14.3% | 72 | 22 | 145 | 15.2% |
| Alexander Semin | 52 | 10 | 92 | 10.9% | 77 | 38 | 243 | 15.6% |
| Sidney Crosby | 81 | 39 | 278 | 14.0% | 79 | 36 | 250 | 14.4% |
| Jonathan Cheechoo | 66 | 9 | 94 | 9.6% | 81 | 28 | 175 | 16.0% |
| Average | 72 | 23 | 160 | 14.3% | 79 | 34 | 208 | 16.1% |
| Jordan Eberle | 69 | 18 | 158 | 11.4% | 78 | 34 | 180 | 18.9% |
In the first year, things look very comparable – Eberle’s shooting percentage (and consequently his goal-scoring) is a bit lower than the group average, but overall he’s in the range. The group managed 2.22 shots/game, on average; Eberle managed 2.30.
In year two, things change dramatically – because while our average group enjoys a modest bump in shooting percentage and a big bump in shots-per-game (they go from 2.22 shots/game up to 2.63 shots/game), Eberle sees no increase in shots-per-game and a massive increase in shooting percentage. Eberle literally goes from firing 2.30 shots per game in his rookie season to 2.31 as a sophomore.
The fact that Eberle’s increase – unlike our group average – is based on shooting percentage and not an increase in shots is troubling, because it raises doubts that his shot totals will increase in the same manner that the group as a whole did. We also know, barely short of a certainty, that his shooting percentage is going to fall from his second year totals.
Knowing what we do, there are three individuals on the chart above worth looking at in more detail: Paul Stastny, Sidney Crosby and Jonathan Cheechoo. What makes those three interesting?

Stastny and Crosby are of interest because they’re the only two players from our sample to see their shot totals in their second season either decrease or show zero growth. Every other player saw their shot totals improve significantly. In both cases, the players went on to show negligible growth over the rest of their careers to date. Stastny fired 2.26 shots/game as a rookie, while on his career he’s fired 2.37 shots/game; Crosby fired 3.43 shots/game as a rookie and his career average currently sits at 3.39 shots/game.

Cheechoo is of interest because he’s the only player on this list with a similar improvement in shooting percentage. Like Eberle – and like nobody else on this list – his shooting percentage jumped ~160 percent from year one to year two. In Cheechoo’s case, he was able to ride the shooting percentage wave for one more season before a long, slow, slide pushed him into the AHL. In his last NHL season (with Ottawa in 2009-10) he scored five goals on 117 shots (4.27 SH%) and he’s now been an ~11% shooter over two AHL seasons.
What are you saying!?!?

It’s important not to draw too firm a conclusion from the players we’ve looked at above – this is a small group and it gets smaller when we look at three individuals who relate to Eberle in some way. However, based on this data, if I had to project how Eberle fares next season I’d go with the following:
- A small increase in shots/game
- A large decrease in shooting percentage
- A significant decrease in goals scored
If I’m forced to pick a number? Over a full season I’d guess Eberle fires the puck ~190 times and scores ~26 goals. There’s any number of ways that could be wrong – particularly if Eberle finds a way to increase the number of shots he takes this season in a significant way – but if I were drawing a line in the sand that’s where I’d put it. I do not expect him to match 2011-12’s totals in 2012-13.
THIS WEEK BY JONATHAN WILLIS
- Would you rather: Alex Semin or Ales Hemsky?
- Report: Shane Doan offered four year, $30 million+ deal
- Should the Oilers be interested in Jonathan Bernier?
- Will the Oilers be able to keep their young core together?
- Big decisions: the Andrew Cogliano trade
- Teddy Purcell re-signs in Tampa Bay
- One year later: Ryan Nugent-Hopkins
- Trades, the Edmonton Oilers, and Magnus Paajarvi
- What to make of the Winnipeg Jets signing Mark Dekanich
- Follow Jonathan Willis on Twitter
Recent articles from Jonathan Willis

