What is the value of a draft pick?
By Jason Gregor
9 years ago
The 2014 NHL entry draft is nine days away, and there has been a lot of discussion about the possibility of the Oilers, Flames, Panthers and Islanders possibly trading up or down. We rarely see much movement within the top-five picks, so it it unlikely these teams trades spots, but in the past we have seen many teams trading up or down once you get past the first ten picks.
Most of those trades occur in the 2nd, 3rd, 4th and 5th rounds, and often we debate if it was a good move. The Columbus Blue Jackets’ director of hockey administration and resident analytics guru, Josh Flynn developed a chart that would rank the value of a draft pick, and it gives us some insight into whether those draft day deals involving picks are good moves or not.
Flynn was not the first to build a value chart, but the ideas behind his interested me.
Rob Mixer wrote an article about Flynn’s chart here. The NFL has had a value chart for years, but you can’t compare it straight up to the NHL, because NFL players are 20-22 of age and they go directly to the NFL. The majority of NHL draft picks spend two to four more years developing in junior or the minors before they crack an NHL lineup. So the success rate of players would be much different, not to mention NFL has 30 more roster spots, so more chance for players to make team. But as a pick for pick value, I think it could be close.
Flynn explained to Mixer how he came up with the value system for his chart.
“I wanted to come up with something to help guide us through
pick-for-pick trades, but the problem was that, in the NFL, players are
going straight into your lineup,” Flynn told BlueJackets.com. “I decided
to think about value of picks this way: what is each pick worth in
terms of what the asset will produce for the club that owns it?“Can you define a pick’s ‘success’ based on how many games the player
plays? You don’t want to rank picks based on how many points the player
produces, because then you get into roles and positions and it gets too
complicated. I said ‘you know what, we’re not going to look at it
objectively.’ When Tyler Wright (former
director of amateur scouting) was here, I’d tell him: when I compare
you to other players based solely on games played, you and Pavel Bure
are the same player. And no offense to Tyler, but I’d rather have Pavel
Bure with my pick. What I ended up doing was grading the
players based on what they became at their peak, and tweaked it based on
how long they sustained that level of play.”When you look at a period of 10-12 years and there’s a 25 percent
success rate in the second round, pick 46 may have produced six guys and
pick 45 produced a few less, but you’d still rather have the 45th
pick.” Flynn said. “We have a tool that we can go into the draft with
and guide our decisions on trades with a real, solid idea of what a pick
is worth.”The value chart used by the Blue Jackets is born from a complex
system that uses data compiled from a dozen years of NHL drafts – dating
back to when the draft was nine rounds deep – and from that data, Flynn
developed a rubric of grading picks on a 1-10 scale (for example, picks
1-210 in a seven-round draft) based on what they produced over time.Flynn then “clustered” the picks together to create a firm value for“Basically, if pick 65 in 2006 produces a player who never played an
each one, and then, places them into a formula that determines the
pick’s final value on the chart.
NHL game, that pick is going to get a zero,” Flynn said. “On the flip
side, you can figure out that the No. 1 overall pick is generally going
to get a higher rankings on the value chart because it has always
produced an NHL player.“The system is designed to show what picks are intrinsically worth,
and it helps us weigh draft positions against each other in terms of
value. The chart is based on what we think each pick will produce, and
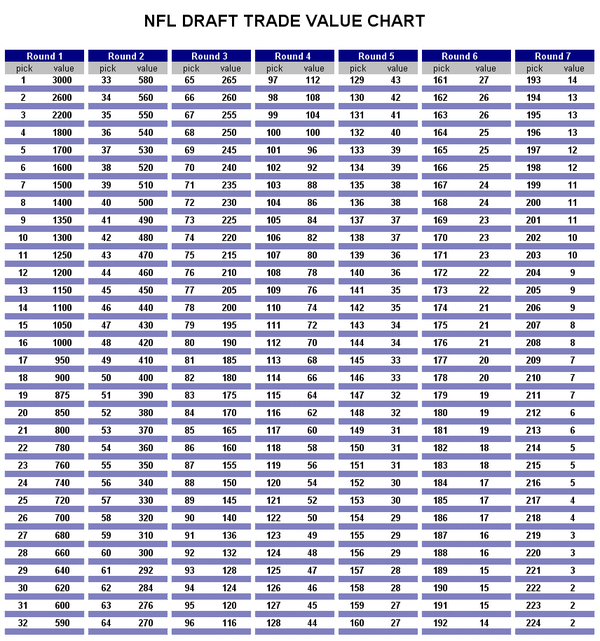
it’s backed up by a dozen years of information.”Here is what NFL chart looks like.It is interesting to look at this if NHL valued picks the same. Many have wondered what it would cost for the Oilers to move up from #3 to #1. If we use that chart, and only include draft picks, it would take the #3 and the #21 (total of 3000), for the Panthers to consider it.I don’t think the Oilers, or any other team, would give up the 21st pick just to move up two spots in the draft, unless there was a Sidney Crosby-type player available. And because it involves 18 or 19 year old kids, there is always going to be wrong decisions. This is just a guideline.In 2002, the Blue Jackets traded up from #3 to #1 with Florida. The Panthers received the option to switch picks with Columbus in 2003 and ended up moving from #4 up to #3 where they took Nathan Horton while the Blue Jackets picked 4th and took Nikolai Zherdev.If you were Craig MacTavish would you offer the #3 this year and the option to switch draft spots next season with the Panthers in exchange for the #1? Would Dale Tallon?Scott Howson was the GM in Columbus when they started using their value chart. Columbus has been using it since 2009. He used it when they traded down from #16 to acquire more picks, and then traded back up from #26 to #21 to take John Moore.Howson was with the Oilers at last year’s draft when MacTavish twice traded down to acquire more picks. For fun, based on above chart chart did the Oilers get good value for their picks?The Oilers traded the #37 to Los Angeles (value of 530) for picks #57 (330), #88 (150) and #96 (116). If you go solely on the numbers the Oilers traded 530 “points” and received 596 in return. Based on this chart that was a good trade for the Oilers.The Oilers then traded the 57th pick to St.Louis (330) for #83 (175), #94 (124) and #113 (68). They traded 330 points for 367. If you judge the trade solely on the value of the picks, MacTavish made another solid deal.Howson was in meetings when I posted this, so I couldn’t get an answer whether he uses a similar with the Oilers, but I will ask him next time we chat.Here are the actual players that were taken with those picks.#37- Valentin Zykov (Kings)
#57- William Carrier (Blues)
#83- Bogdan Yakimov
#88- Anton Slepyshev
#94- Jackson Houck
#96- Aidan Muir
#113- Ben BetkerIt is much too early to say which team will benefit the most from these deals, but I plan on using this chart during next Friday’s draft as a guideline to see which teams make good value trades based on his data. I know it isn’t exact, because it is football, but the NHL one likely has similar differences in picks from round 2-7.I’m sure there are other charts out there, and if you know of any let me know. I’ve researched draft picks in the past and from the 1996-2005 drafts my data suggested teams had a 60% chance of getting a good NHL player in the first round, a 23.7% chance in the 2nd round, 15.8% in
the 3rd, 8.6% in the 4th, 7.1% in the 5th, 9.1% in the 6th and 9.7% in the 7th round.It sound like Flynn’s chart is more precise to the value of each pick rather than just the round, and I will be closely monitoring this year’s draft to see which teams made good value trades.What makes it fun is that every team scouts and fan base will value a player differently, regardless of what the chart says. You can play the percentages, but if you are a gambler you know that sometimes you go with your gut despite what the odds tell you.PRESEASON…
If you missed it the Oilers released their preseason schedule yesterday.
Date Opponent Time Sunday, Sept 21st Calgary Home (split squad) 6 p.m. Sunday,
Sept 21stCalgary Road (split squad) TDB Wednesday,
Sept 24thWinnipeg Road 7 p.m. Sunday,
Sept 28thChicago Road (In Saskatoon) 4 p.m. Monday,
Sept 29thWinnipeg Home 7 p.m. Wednesday,
Oct 1stArizona Home 7 p.m. Thursday,
Oct 2ndVancouver Home 7 p.m. Saturday,
Oct 4thVancouver Road 7 p.m. It would be nice if the game in Calgary on the 21st was an afternoon game, which would allow for both games to be televised on Sportsnet. Fans could watch a battle of Alberta double header. Fans of both teams will be starving for hockey by then, and I’m sure the audience numbers would be decent.It also looks like the Oilers will make most of their cuts late in camp. The Oilers play five games in seven days and I’m guessing Dallas Eakins will want extra bodies in camp so no one has to play more than three games in the final week.Recently by Jason Gregor:
- What is Stralman worth?
- Next season begins now.
- Finally! Eakins gets to pick his staff.
- How has scouting changed?
- OATES: My mindset is I want to be a head coach.
- STU MACGREGOR DISCUSSES THE DRAFT
Recent articles from Jason Gregor

